Application Software
Resource Allocation
Optimal resource allocation is a decision support process that enables decision makers to evaluate in real-time the costs and benefits of various courses of possible investment quickly and accurately to achieve the “best” outcome among competing choices.
In the Orion Case Study on this topic, the objective was to define the most cost-effective investment strategy related to improving the accuracy of the Orion thermal protection system (TPS, or heat shield) reliability assessment process. However, because of the large number of contributors to uncertainty, a consistent and repeatable methodology to aid in this decision process is required.
For the example noted, a team of Subject Matter Experts (SMEs) identified 19 possible investment areas related to the Reliability Assessment Process (see Figure 1). In order to assess the optimal investment strategy, it was necessary to construct, for each of the possible investment areas, cost-to-benefit models, and to quantify their associated uncertainties. Significantly, all the cost-to-benefit models must be compatible; that is, they must all show cost-to-benefit on the same type of scale, typically a monetary unit. Also, the cost-to-benefit models must be calibrated to the number of units that can be purchased, noting any possible limitations or discounts in the way units can be acquired (e.g., “buy one get one free,” or “limit 10 units per customer”).
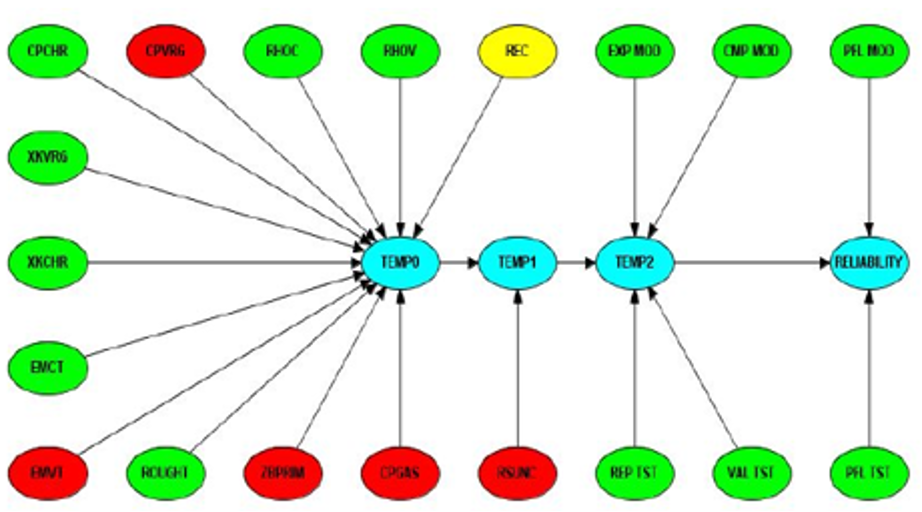
Figure 1.
Illustration of the Optimal Resource Allocation Process.
The team was initially skeptical of this process. The default assumption among the team members was that only one specific type of investment (new arc jet data) was the only investment that could improve the reliability assessment process. However, unless the existing arc jet data are completely discarded, the new data can only impact the statistical metrics (mean value and standard deviation) of the resulting data set (existing plus new data) to a certain extent. A rigorous mathematically and statically based technique was proposed that bounded the effects that obtaining new data could have upon resulting data set statistical metrics. Cost modeling proved to be generally quite easy, whereas benefit modeling among the various options proved to be more challenging.
As a demonstration, PredictionProbe proposed a manual, TPS-specific, prototype resource allocation process. This process built upon the existing reliability assessment process described in a companion Case Study. The additional cost and benefit modeling needed to evaluate each of the potential investment options for their cost-effective influence on the system reliability estimate was based upon interviews with each of the selected SMEs. The team of SMEs included people from management, and specialists in several areas including testing, aerothermal effects, trajectory, and computational modeling. Each SME was individually asked to provide a numerical rating (from zero to unity), to numerically quantify the investment choices available with respect to their potential to improve the reliability assessment process. Here, zero = worst possible investment area, and unity = best possible investment area as judged for the cost effectiveness of 19 options. The responses for each investment choice and each SME were recorded. For each investment choice, statistical metrics were then constructed (mean value, average, 90% low value and 90% high value). The statistical metrics for each investment choice were then presented back to the team for discussion without any attribution of specific values for the rankings.
Using the established reliability process, the information flow operations were then implemented within three distinct executions of the Bayesian network software The first solution used the 90% Lo numerical values, the second solution used the team average values and the third solution used the 90% Hi values; this technique avoided the possibility of having zeroes or unity values contaminating the Bayesian analyses that might occur if those analyses used the minimum and maximum SME values for each investment area.
The investment options included additional testing for each of the relevant material properties, as well as additional testing to reduce key uncertainties in the process, improved arc jet testing capabilities, improved computational capabilities, improved failure mode modeling, and additional failure mode testing. The complete list of investment choices (as shown in Figure 1) was:
- RHOV: Additional material properties testing for virgin density
- RHOC: Additional material properties testing for char density
- CPVRG: Additional material properties testing for virgin specific heat
- CPCHR: Additional material properties testing for char specific heat
- XKVRG: Additional material properties testing for virgin thermal conductivity
- XKCHR: Additional material properties testing for char thermal conductivity
- EMVT: Additional material properties testing for virgin emissivity
- EMCT: Additional material properties testing for char emissivity
- ROUGHT: Additional material properties testing for surface roughness effects
- ZBPRIM: Additional material properties testing for normalized recession model (B’ tables)
- CPGAS: Additional material properties testing for pyrolysis gas blowing coefficient
- REC: Improved recession amount uncertainty
- RS FIT: Improved recession response surface fit uncertainty (Additional STAB cases to be executed for each reliability case)
- EXP MOD: Improved arc jet testing capability
- CMP MOD: Improved computational (STAB) capability
- PFL MOD: Improve failure mode modeling
- REP TST: Additional arc jet test reproducibility test pairs; each reproducibility pair consists of two arc jet tests conducted at the same conditions within the same facility
The green nodes in the figure represented high value investment areas (i.e., “low-hanging fruit”), yellow nodes represented medium value investment areas and red nodes represented poor investment areas. Given specific investment thresholds (amounts of investment) and the cost to benefit models for ach investment areas, a number of actionable specific scenarios (buy X units of Y to get Z benefit) were presented to the Orion Management for consideration and implementation. Ultimately, a fully automated and generic combined probabilistic and Bayesian framework that can accommodate a flow of uncertain information forward and backward, and which allows for using expert opinion mixed with physics-based probabilities is desirable. The tools and knowledge exist to accomplish this probabilistic and Bayesian integration, but the workload exceeded the scope of this Orion demonstration project.