Application Software
COVID-19 Hot Spot Projection
PredictionProbe, Inc. (PPI) has undertaken a comprehensive program to demonstrate how probabilistic tools can be used for gas turbine components to be able to improve overall performance as well as reliability and total system cost.

Project Overview
According to Wikipedia, the coronavirus disease 2019 (COVID-19) is an infectious disease caused by severe acute respiratory syndrome coronavirus 2 (SARS-CoV-2). Figures 1 and 2 show images of the virus made using scanning and transmission electron microscopes at the National Institute of Allergy and Infectious Diseases’ Rocky Mountain Laboratories in Hamilton, Montana. NIAID is part of the National Institutes of Health. Figure 3 shows the size of the COVID-19 virus compared to a typical red blood cell.
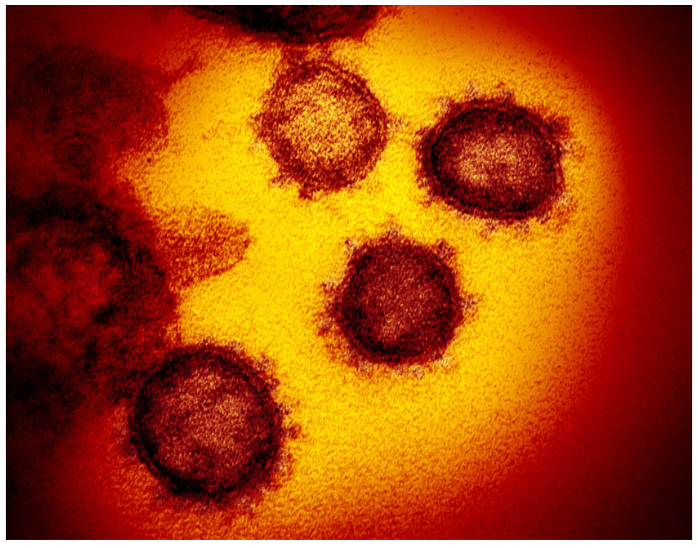
Figure 1.
Image of the COVID-19 virus from a transmission electron microscope.
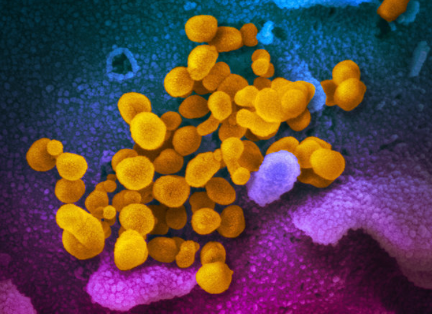
Figure 2.
Image of the virus (orange) emerging from cells cultured in the lab.
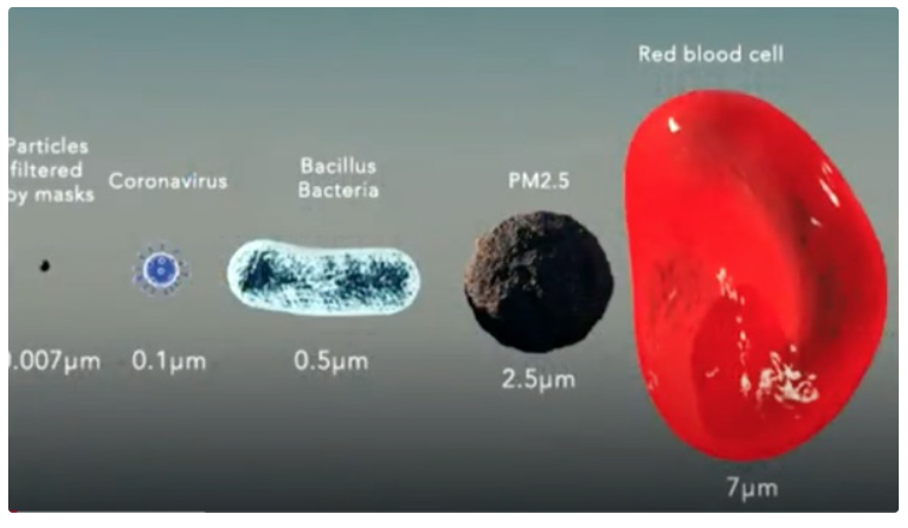
Figure 3.
Illustration showing the size of the COVID-19 virus compared with a typical red blood cell.
The World Health Organization (WHO) was first alerted to several cases of pneumonia in Wuhan, a city in the Chinese province of Hubei, on December 31, 2019. In retrospect, the first case can be traced back to 17 November 2019. According to the first WHO situation report on the coronavirus disease, the cases of pneumonia had no known cause, and totaled 44 by January 3. By January 7, the exact strain—a new type of coronavirus—was identified, and initially named 2019-nCoV.
In February, the World Health Organization officially began calling the disease COVID-19. Thailand reported its first case of COVID-19 on January 13. The infected individual had traveled there from Wuhan.
Japan reported its first case on January 15, also in a person who had visited Wuhan. On January 21, Washington State reported the first case of the new coronavirus in the United States in a man who had returned from Wuhan, China. The first instance of a person transmitting COVID-19 to another person while in the United States was reported in Chicago, Illinois, on January 30. A woman in her 60s contracted the virus while caring for her father in China, passing it to her husband when she returned home. The early cases of COVID-19 in the U.S. were limited to people who had traveled from China and those they interacted closely with. But on February 26, the CDC confirmed a case in California with no reported travel connection to China or exposure to another person with COVID-19. This marked the first possible instance of community spread—the spread of an illness with an unknown source of infection. By March 26, the U.S. had more confirmed global COVID-19 cases than any other country. As of June 15, 2020, the CDC reported more than two million confirmed cases. Also, as of June 15, 2020, in data obtained from https://datausa.io/coronavirus and as shown in Figures 4 through 6 (logarithmic vertical scales), the scope of the pandemic continues to grow in confirmed cases, deaths and hospitalizations. Figure 7 shows the percent of positive tests (logarithmic vertical scale) is declining somewhat over time for most but not all states. Based upon sources familiar with PredictionProbe, Inc.’s (PPI) prior work and successes, PPI was requested to provide COVID-19 projections for the Missouri National Guard on a state, regional and county level of scale.

Figure 4.
Number of Confirmed Cases by State.
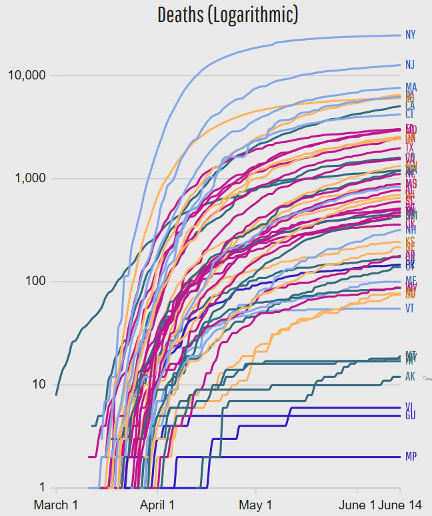
Figure 5.
Number of Deaths by State.

Figure 6.
Number of Hospitaliations by State.
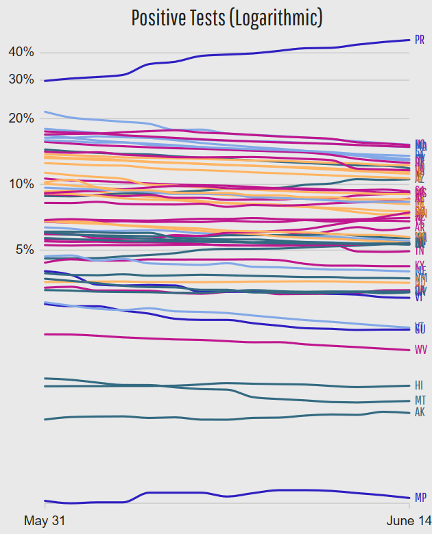
Figure 7.
Number of Percent Positive Tests by State
Problem Definition
A major concern with this disease has been its ability to spread rapidly. Since the virus was completely new to humans, almost nothing was known initially about the how the virus spread, how quickly it could spread, or how deadly it was. For example, it was unknown how factors such as the population density of a given area and how various proposed counter measures (e.g., the wearing of masks and social distancing) would affect the disease spread. Hence, this was a problem with many uncertainties present, many of which had never even been quantified to any extent.
When PPI began to consider the problem, the first decision to be made was how to model the spread of the COVID-19. The most relevant existing models to predict the spread of the COVID-19 disease were based upon those for influenza, but this class of models had many incorrect assumptions embedded in them. The goal of the PPI work was to enable rapid turn-around of many projections (at the state, regional, and county levels), with daily updates, to predict the rate of spread of the disease. This would enable informed decisions to be made for hospitalization resources, including medical staffing, the number of beds and intensive care units needed, the number of respirators and ventilators needed, and the extent and types medical equipment needed. But the PPI team viewed this crisis management application as part of a much larger problem and identified many needs and possible applications for this type of Predictive Technology beyond the initial domain of health care planning for the COVID-19 infection.
PredictionProbe’s Solution
The PPI team committed to provide these COVID-19 health care need projections to the Missouri National Guard without any promised funding. PPI quickly formulated a plan of attack within hours of their initial contact with the Missouri National Guard. The plan involved starting to make projections with the existing KS model, comparing the results with other models such as the IMHE model, all while assessing the strengths and weaknesses of other available models. The PPI team also identified a list of factors that could influence the spread of the COVID-19 virus; these factors could be used to modify the KS model or to enable the development of a new model. This list of factors included: 1) the level of known exposure to the virus, 2) the maximum population and population density in a given area, 3) the type, extent and enforcement level of any proposed countermeasures, 4) the portions of the population that might be more or less prone to infection, and 5) the number of symptoms that a person may be exhibiting in a given situation.
To provide a comprehensive and easily extensible and reconfigurable solution, the PPI team also identified many needs and possible applications for this type of Predictive Technology beyond the initial domain of health care planning for the first wave of the COVID-19 infection. For example, beyond the initial need for health care management, PPI identified an extended need for test development / deployment and reliability assessment exists. Beyond that, a need exists for vaccine planning / development / deployment and reliability assessment. Ultimately, this type of prediction and projection capability can be extended into other similar arenas such as other similar diseases, water and food shortages, and possibly even other applications. These additional applications were considered in the design of the combined probabilistic and Bayesian technology solution proposed and implemented by PPI.
Every one of these applications will be data / modeling driven and subject to many classes and magnitudes of uncertainty. There will also be, perhaps, numerous constraints that must be considered. The capabilities required for these diverse applications include a combination of: 1) the creation and integration of predictive models, 2) the modeling and integration of various uncertainty sources, 3) optimization under uncertainty, and 4) the use of probabilistic and Bayesian technologies. There is a need for a user-friendly, quickly executing tool that can be used to enable rapid, risk-informed decisions by non-engineering users, without the assistance of software specialists. Ideally, the tool can be used by management within the setting of meeting in which decision alternatives need to be quickly evaluated. The tool must provide the specific capabilities of uncertainty/risk analysis, quantification, propagation, decomposition, and management, robust/reliability design methods, and extensions of these capabilities into decision analysis methods.
Such decision support tools must provide whatever are the required capabilities across a potentially wide variety of traditional specialty areas (disciplines). Decision support tools should also perform analyses which span across, and are distinct from, these specialty areas to support the process of making decisions based upon computational simulations. For example, systems integration, multidisciplinary optimization, life cycle cost analyses, uncertainty/risk analysis and management, reliability assessment methods, technology assessments, research portfolio analyses, and “system of systems” architecture analyses all fall into this category of capabilities. For convenience, this group of disciplines will simply be referred to collectively herein as Decision Support (DS) methods and tools. The full extent of these needs is described in accompanying Case Studies related to Decision Support (DS) for the Orion Space Capsule and the Space Communication and Navigation system. These DS methods and tools are closely related to the processes of systems analysis (SA) and/or systems engineering (SE). The architecture of a real-time decision support tool must be very flexible and easily reconfigurable to enable all of the aspects of DS, SA and SE to be implemented in a user-friendly environment.
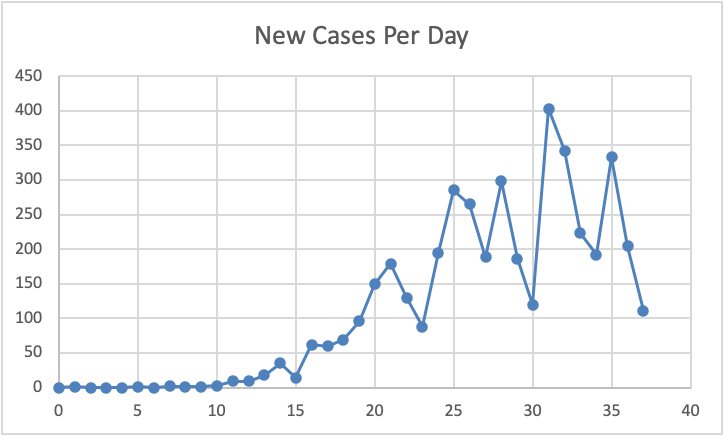
Figure 8.
Illustration of the New Cases Per Day for Missouri.
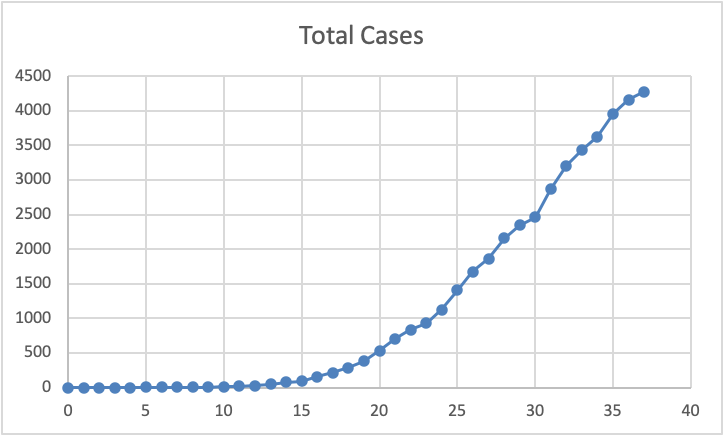
Figure 9.
Illustration of the accumulated Total Cases for Missouri.
Data was obtained from the Missouri National Guard which detailed the daily count of new cases (see statewide data in Figure 8, through April 14, 2020) and accumulated total cases (see statewide data Figure 9, through April 14, 2020) for each county in the state of Missouri. These counties were then grouped by the state into regions and data for the individual counties or the larger regions could be tallied to provide data for the whole state. Other sources were identified to provide comparison data form other counties across the United Sates, other states, and other countries, and the population densities of each of these entities was also identified. The timeline of progression of the disease across various countries, states and counties was also likewise studied. These numerous effects were considered in formulating the predictive modeling used by PPI.
The PPI projection approach was twofold: 1) starting from the raw data representing new cases per day, and 2) starting from the raw data representing the accumulated number of cases over time. The two datasets are, of course, related in that the first is the derivative of the second; put another way, the second dataset is the integral of the first. The first approach involved modeling a very rough phenomena subject to considerable daily variability (Figure 8); New Cases Per day are plotted as a function of the number days since the first reported case. The second approach leveraged the inherently smoother nature of an integral function (Figure 9), rather than a derivative function, again with total cases plotted as a function of the number days since the first reported case.
Having selected a data set type (either New Cases Per Day or Total Cases) for the modeling approach, an Monte Carlo Simulation (MCS) optimization under uncertainty was performed to find best fit values for the model parameters to enable projection of the data forward in time beyond the extent of the existing data set. The best fit parameter optimizations included modifications to reflect the observed timeline of the disease progression based upon the effects of population density and the level of countermeasures in place. Then, having created a predictive model over time of selected data set, either probabilistic analysis or and an additional two MCS optimizations under uncertainty were used to compute each of the upper and lower bounds for the projection.
Results & Conclusions
Initial projection and bounding results were obtained within just a few days of the first interactions with the Missouri National Guard. Additional data sets were provided on a nearly daily basis and these new data points were assimilated into the projection and bounding methods. These results were based upon the existing KS projection model. Additional automation features and modeling enhancements were later added to the projection methods within the first two weeks of the PPI response. All of the following results are based upon the most recent data set (dated April 14, 2020) that PPI received from the Missouri National Guard. In each figure, the peak value and date are indicated. For total projections, the peak value always occurs at the end of the simulation, chosen to be 100 days from the start.
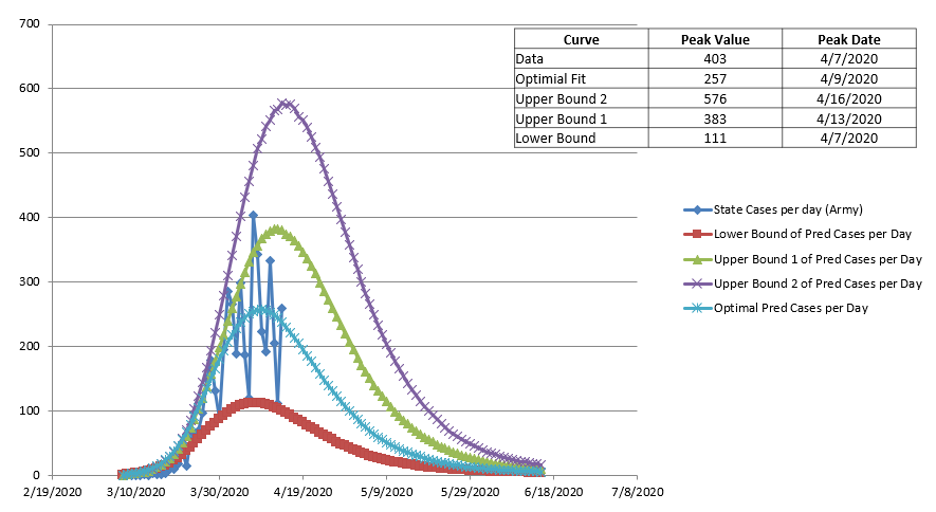
Figure 10.
Example projection results for New Cases Per Day.

Figure 11.
Example projection results for Total Cases.
Example projection results for New Cases Per Day are shown in Figure 10. The blue curve with diamond symbol is the actual data. The blue curve with “X” symbols is the PPI projection. In this case, two upper bounds have been computed: 1) the purple curve with “X” symbols bounds the more recent data better, whereas 2) the green curve with tringle symbols bounds the earlier data better. The red curve with square symbols is the lower bound of the data. Example projection results for Total Cases are shown in Figure 11. The bounding curves in Figures 11 are based on the same parameters as those shown in Figure 10.
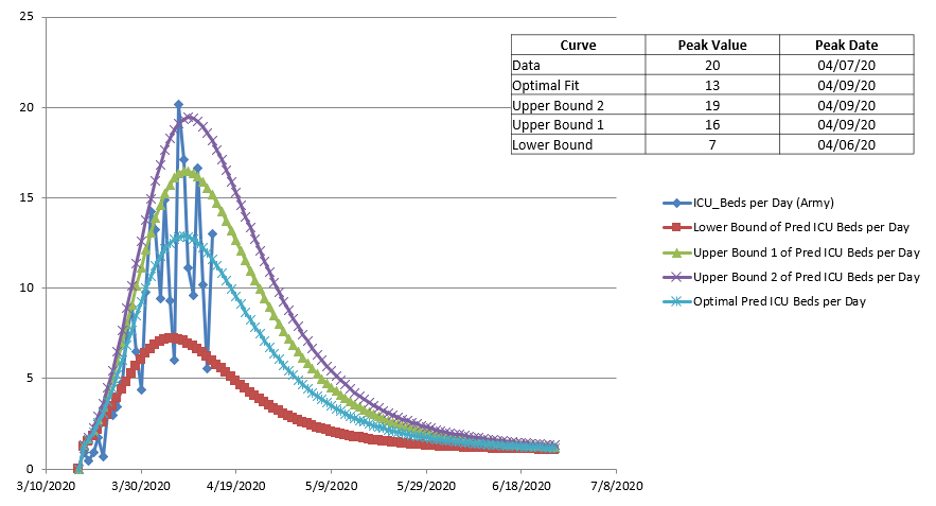
Figure 12.
Example projection results for New ICU Cases Per Day.
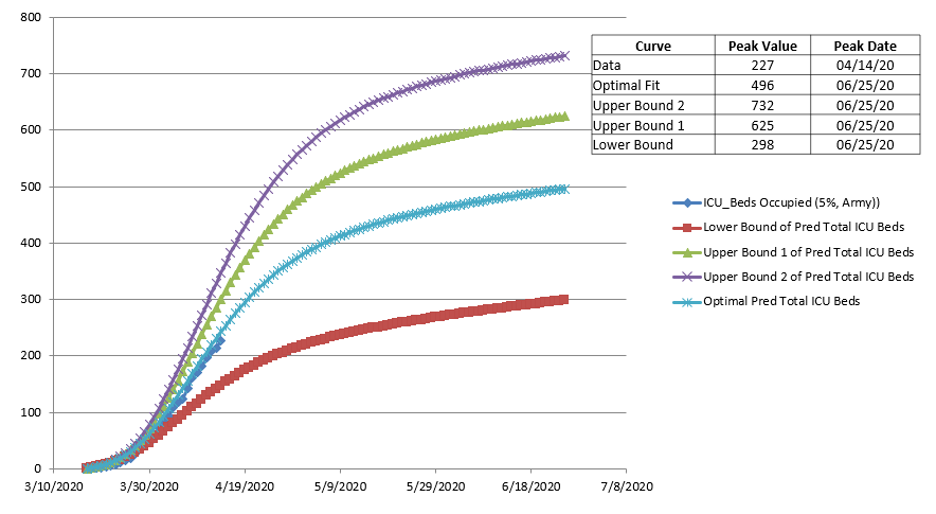
Figure 13.
Example projection results for Total ICU Cases.
The requirements for Intensive Care Unit (ICU) beds are shown in Figure 12 for new ICU beds required per day and in Figure 13 for total ICU beds required. Again, the bounding curves are based upon the same optimal parameters as those in Figures 10 and 11. The number of deaths is shown in Figures 14 and 15, as new deaths per day and total, respectively. These were based upon 5% of the total cases recorded.

Figure 14.
Example projection results for New Deaths Per Day.
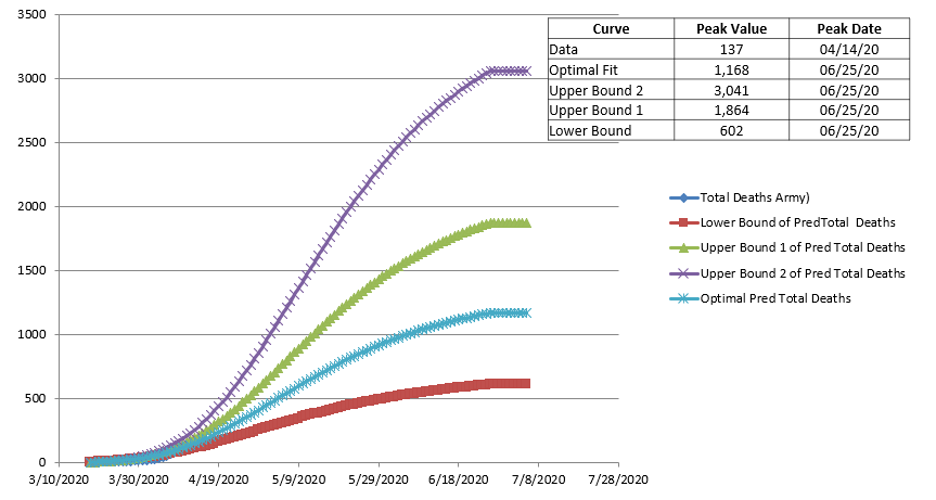
Figure 15.
Example projection results for Total Deaths.
Ultimately, a comprehensive plan of addressing the numerous aspects of the potential applications of this technology was proposed to the Governor’s Office of Missouri. This proposal included:
- Identification of the hot spots and their priority orders based on peak day;
- Optimal “smart” distribution of testing and vaccine distributions;
- Optimal allocation of health care resources (people, equipment, test kits, vaccines, etc.) within a given scope of consideration (city, county, region, state, country);
- Reliability and sensitivity assessments for testing kits and vaccines; and
- Process improvements for vaccine developments.