SCaN – Cost of Uncertainty Assessment
Ensuring Affordability for Mission Critical
Due to the mission critical nature of the Space Communication and Navigation satellite dishes, ground structures, antennae, power generation, etc. and the degraded reliability of a system under duress, repair, or failure, this effort demonstrated and exemplified the impact of uncertainty on aging, failed, and damaged equipment and its overall impact on the SCaN systems through multiple comprehensive simulations and demonstrations.
Project Overview
The objective of this effort was to demonstrate how PredictionProbe, Inc.’s (PPI) Technologies can be used to create a decision support capability that can be used to assess and quantify the reliability of the existing and future National Aeronautics and Space Administration (NASA) Space Communication and Navigation networks (SCaN).
The project was designed to provide capabilities for: 1) evaluating new concepts (e.g., optical vs. radio frequency); 2) optimal modification of the existing radio frequency network; 3) evaluating current and possible future maintenance procedures; 4) development of reliability assessment and improvement strategies, and 5) development of a plan for compiling and/or producing appropriate data to guide optimal maintenance and acquisitions. The work enhances system reliability, availability, and maintainability of SCaN Network operations, enables optimal resource allocation, and identified reliability weakness and vulnerabilities that could impact the SCaN system performance and mission success.
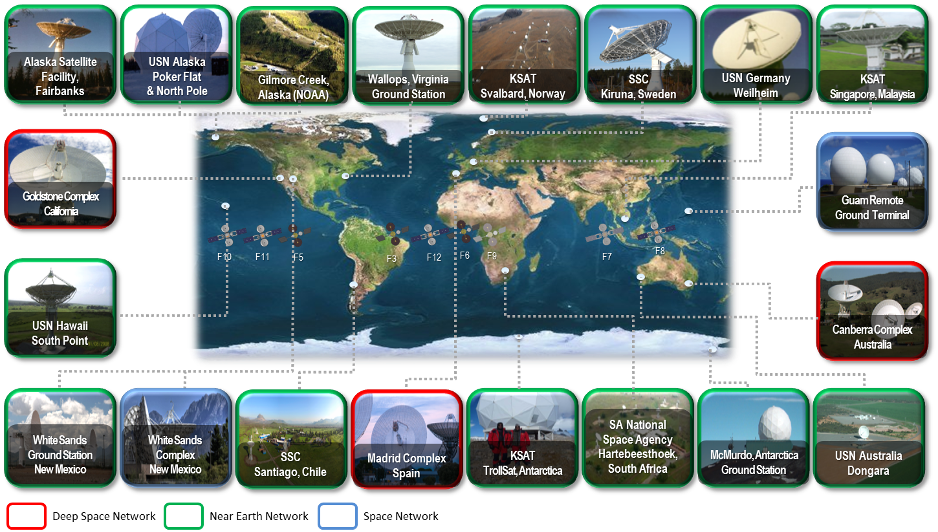
Figure 1.
The NASA Space Communication and Navigation Network
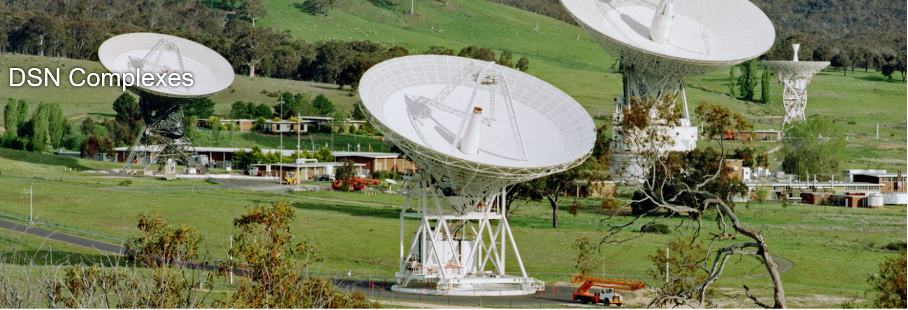
Figure 2.
Example of a NASA SCaN Deep Space Network (DSN) Complex.
In this effort, PPI was contracted by the NASA Glenn Research Center (GRC) to demonstrate capability and sample results related to quantifying the cost of uncertainty within a combined probabilistic and Bayesian analysis reliability assessment of the NASA SCaN assets. The existing NASA SCaN network consists of many ground-based and space-based assets. The ground-based assets include many communication antennas of various diameters (up to 70 meters or about 230 feet), command centers, networks, controllers, data storage and data processing facilities. The space-based assets include a fleet of earth-orbiting NASA communications satellites. Beyond this, hundreds of national and international, commercial, and academic customers use the SCaN assets to transfer data to earth from their in-space and remote assets. As shown in Figure 1, the NASA SCaN assets are organized under three divisions: the Deep Space Network (DSN, see Figure 2), the Near Earth Network (NEN, see Figure 3) and the Space Network (SN, see Figure 4).
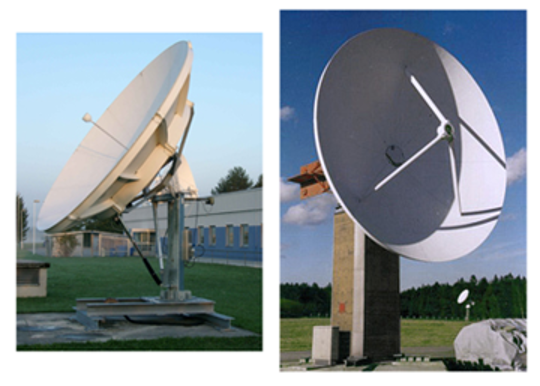
Figure 3.
Example of SCaN Near Earth Network (NEN) Complex.
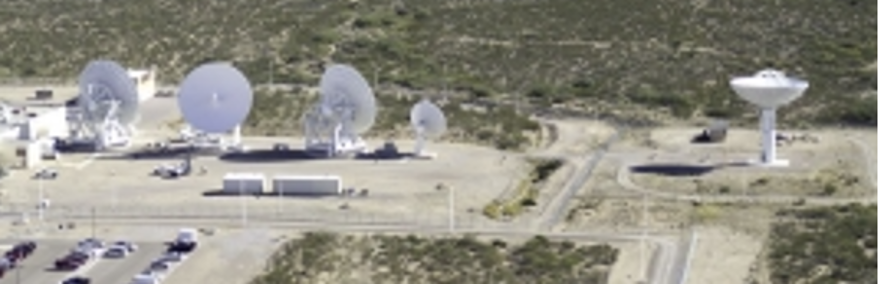
Figure 4.
Example of a NASA SCaN Space Network (SN) Complex.
Problem Definition
As noted above, the SCaN Network consists of many assets such as ground assets, in-space assets and even remote assets (e.g., mars rover), all organized under three divisions of SCaN: i) the Deep Space Network (DSN), ii) the Near Earth Network (NEN), and iii) the Space Network (SN). Each asset is comprised of one or more systems (antennae, power generation, power storage, networking, etc.) and numerous sub-systems (e.g., sub-systems within the antennae system include gimbal, ground structure, dish, etc.). Likewise, each sub-system may contain numerous components such as amplifiers, polarizers, and diplexers. The reliability of each component and sub-system affects the reliability of the system-level assets in which they are contained, and the reliability of each asset, in turn, influences the overall reliability of the SCaN network.
While these assets, systems, sub-systems and components have each been designed to meet certain reliability levels, in practice however, the actual reliability of these systems and assets are uncertain due to numerous uncertainties such as physical damage, power outages or interruptions, environmental conditions, unforeseen usage scenarios, and so on. Some of the components are extremely expensive such as the large antennae dishes, their gimbal mechanisms and support structures. All of the components have an expected lifetime and replacement cost. There should be a planned maintenance schedule to inspect and replace all components before they fail but this schedule may not be rigorously followed, especially under tight budget situations. When components unexpectedly fail prematurely, a cascade of effects can occur. First, unplanned replacement parts and repair maintenance are needed; this could mean that other scheduled maintenance may be delayed or cancelled. The reliability of the system is degraded while the repair maintenance is taking place and unusual operating procedures may be employed to make up for the degraded system reliability. These unusual operating procedures may further stress other components and systems. Additional costs are incurred because of extra parts that are needed and sub-system or component maintenance may be performed at non-optimal times for the remainder of the system.
PredictionProbe’s Solution
In order to demonstrate the cost of uncertainty within the reliability assessment context, two different Monte Carlo Simulation (MCS) approaches were undertaken. The first was to define a system of 100 components. Each part was randomly assigned an expected lifetime. For each MCS execution, a certain controlled amount of uncertainty in the expected lifetime (0% to 50%) was imposed. The actual lifetime of each component was computed based upon the expected lifetime and a random amount of imposed uncertainty. The replacement cost due to the premature component failures were tallied. Confidence bounds in the total system cost over-run above the ideal replacement cost were identified over a number of random simulations.
The second approach was to apply a similar MCS approach to the actual components within the fourth demonstration of the Reliability Assessment, described in a separate Case Study. This Fourth Demo Network was a highly detailed, multi-faceted probabilistic reliability assessment of two 34-meter antennae (DSS-25 and DSS-26) within the SCaN / DSN Goldstone Complex. This example analyzes and compares the reliability for seven services:
- Service 1 (S1): X-Band Downlink on DSS-25
- Service 2 (S2): Ka-Band Downlink on DSS-25
- Service 3 (S3): X-Band Uplink on DSS-25
- Service 4 (S4): Ka-Band Uplink on DSS-25
- Service 5 (S5): X-Band Downlink on DSS-26
- Service 6 (S6): Ka-Band Downlink on DSS-26
- Service 7 (S7): X-Band Uplink on DSS-26
A block diagram of the SPISE workflow for DSS-25 Downlink in this example is shown in Figure 5. The other workflows for this demonstration are similar, except that DSS-26 only offers X-Band Uplink. To quantify the cost of uncertainty, the NASA SCaN Team defined for PPI the expected lifespans of each of the components. The replacement cost was defined to be proportional to the expected lifespan. As discussed above, a controlled amount of uncertainty in the expected lifespan (0% to 50%) was imposed upon numerous MCS executions.
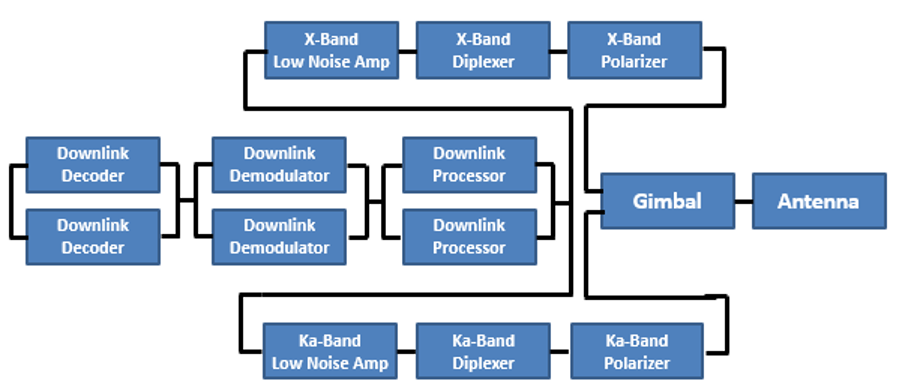
Figure 5.
Block Diagram of the DSS-25 Downlink Service from The Fourth Demo Problem.
Results & Conclusions
Figure 6 illustrates the normalized costs of uncertainty in the system as a function of the amount of imposed uncertainty. The increased amount in replacement costs above the ideal replacement cost are shown. The confidence bounds from the first part of this assessment are shown in Figure 6, along with the mean value increases for the DSS-25 and DSS-26 systems. Despite using different calculation assumptions, the DSS-25 and DSS-26 overlays are remarkably consistent with the confidence bounds derived from the first part of the exercise. As shown in this Figure, uncertainty increases the system replacement costs, and the increases in replacement costs can be quantified. A combined probabilistic and Bayesian approach can be used to define inspection and maintenance schedules; data collection and use will greatly help in reducing cost increases due to part lifespan uncertainty.
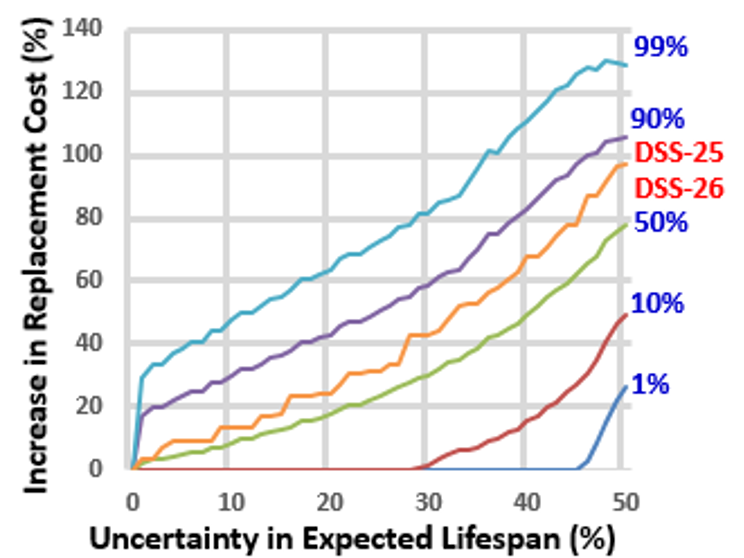
Figure 6.
Sample Reliability Results from The Fourth Demo Network.
About PredictionProbe, Inc.
PredictionProbe, Inc. is a small business and proud provider of an elite offering of world-class predictive technologies, tools, and services that enable decision makers with real solutions for real world challenges. To learn more visit us at: predictionprobe.com
PredictionProbe, Inc. ©2020. All rights reserved.